Change in online revenue 2023 to 2024

Change in number of online gifts 2023 to 2024


When I was one-and-twenty
I heard a wise man say,
‘Give crowns and pounds and guineas
But not your heart away;
Give pearls away and rubies
But keep your fancy free.’
But I was one-and-twenty,
No use to talk to me.
When I was one-and-twenty
I heard him say again,
‘The heart out of the bosom
Was never given in vain;
’Tis paid with sighs a plenty
And sold for endless rue.’
And I am two-and-twenty,
And oh, ’tis true, ’tis true.
We’ll be talking a lot about averages, but the truth is that none of the organisations that participated in Benchmarks are average. And not just in the “you are all special and wonderful in your own unique way” sense, although, yes, that too. It’s that every programme has its own strengths and challenges and context.
As we walk through the data, it’s helpful to remember what we are looking at. The averages we report represent the median: results for half of participants will fall below that figure, and half of participants above. Sometimes, we find a tight clustering around that median value, and it accurately reflects the experience of most organisations. Other times, the range of results varies more widely.
The average change in online revenue in 2024 for nonprofits in the UK and Ireland was a 2% decline. In other countries, nonprofits reported an average increase of 2%.
Change in online revenue 2023 to 2024
Change in number of online gifts 2023 to 2024
Of course, we’d rather see a 2% increase in revenue than a 2% decrease, but this difference is not necessarily an indication that organisations within the UK and Ireland had a tougher time of it in 2024. If we look at the distribution, we find a fairly wide range of results, with UK/Ireland nonprofits at the 75th percentile reporting a 10% increase in revenue, comparable to the 10% increase at the 75th percentile for other countries.
There were also stark differences by sector. Disaster/International Aid organisations reported a 17% drop in online revenue from the previous year. Even at the 75th percentile, this sector reported 11% lower online revenue than the previous year. It’s worth noting that this sector made up a larger proportion of the overall participant pool in the UK and Ireland than in our “Other Countries” cohort.
By contrast, Wildlife/Animal Welfare organisations saw 8% average growth in revenue, with most participants reporting at least some increase. Smaller organisations (those with annual online revenue under £3 million / €3.63 million) increased revenue by 6% on average, but there was wide variance between individual participants.
Taking a longer view also helps put the 2024 change in context. The 2% decline in average revenue followed increases of 6%, 8%, and 3% over the previous three years. For many organisations, this incremental growth builds on a dramatic increase in revenue in the first year of the COVID pandemic.
The significant decline in revenue reported by the Disaster/International Aid sector was in part a reflection of a major spike in giving in 2022. That year, coinciding with the invasion of Ukraine, Disaster/International Aid organisations reported a 24% increase in online revenue.
Online revenue change year over year

For organisations that engage in emergency humanitarian response, donor support can rise and fall dramatically depending on news headlines. One of the ways that organisations stabilise revenue over time is by prioritising regular giving.
While cash revenue fell by 6% in 2024, revenue from regular giving increased by 8%. This continues a long-term term trend; we report faster growth in regular giving than cash giving every single time we measure it for Benchmarks.
The divergence was especially stark for the Disaster/International Aid nonprofits. For this sector, regular giving increased by 8%, more or less aligned with other issue areas. Cash giving, on the other hand, dropped by 25% from the previous year. It’s clear that Disaster/International Aid organisations are continuing to recruit supporters and engage them over the long term. It’s just as clear that the challenges of retaining emergency donors had a significant impact on overall revenue.
Change in online revenue by type 2023 to 2024

Regular giving made up 48% of online revenue in 2024 for organisations in the UK and Ireland. If regular giving continues to grow faster than cash giving, it will soon make up the larger share of revenue. That was already the case for many participants — regular giving accounted for 61% of revenue for Rights organisations, and 61% for Wildlife/Animal Welfare organisations.
Regular giving as a percentage of online revenue

The average regular donation for UK and Ireland organisations was £10 (€12); the average cash donation was £53 (€64). In our Other Countries cohort (primarily US-based nonprofits), average gift was a bit more than twice as high: £23 (€28) for regular donations, and £112 (€136) for cash donations.
Average Gift (£)

Average gift (€)

An average organisation, if such a thing existed, would look like this: an online programme that increasingly relies on regular giving, with overall revenue on a gradual-if-inconsistent upward trend. If that average organisation happened to be dedicated to international humanitarian relief, it would also be contending with unpredictable swings in cash giving, depending on the public focus on acute crises.
That’s if any of you were average.
Online revenue change year over year
Change in online revenue by type 2023 to 2024
Change in number of online gifts 2023 to 2024
Average Gift (£)
Average gift (€)
Change in online revenue 2023 to 2024
Regular giving as a percentage of online revenue
Rise like Lions after slumber
In unvanquishable number,
Shake your chains to earth like dew
Which in sleep had fallen on you-
Ye are many - they are few.
The world is determined to make our jobs more difficult. With changes in email viewing on mobile, AI email overview, and more users abandoning email landing pages only to make subsequent donations that are not sourced to email links, the attribution for email is only getting more complex. Growing our audiences, reaching them effectively, and converting them to supporters has never been more challenging.
Email list sizes grew faster for UK and Ireland nonprofits than for nonprofits in our Other Countries segment over the past few years. In the UK and Ireland, we saw a 4% growth in email list size in 2024, a slower growth following big periods of growth, 10% and 9% increases in list size over the previous two years. For our Other Countries nonprofits, the same period saw 3%, 6%, and 3% growth.
List growth

There are some minor outliers in some sectors in some years, but the recent history of email list size is one of slow, fairly steady growth.
That growth represents the net change in active email file size — the balance of new subscribers against those lost to churn or moved to inactive status by nonprofits looking to protect their sender reputations.
Nonprofits added an average of 0.34 new email subscribers for every subscriber they had at the start of the year. That means that a nonprofit that had a list size of exactly 100,000 subscribers on 1 January, 2024 would add 34,000 new subscribers by 31 December.
Ratio of new joins to start of year email list size

Every new subscriber helps grow a nonprofit’s community, expands its reach, and creates new opportunities for advocacy, fundraising, and mobilisation.
The flipside of acquisition is churn. For UK and Ireland nonprofits, an average 5.1% of email addresses on file on 1 January 1, 2024 were lost due to bounces, and another 9.7% left via unsubscribes.
Bounces and Unsubscribes

Bounce rates tend to follow within a narrow range — they are primarily driven by changes in a user’s email status, like switching jobs or deciding at long last that it is time to move on from your old GothPoeFan97@hotmail.com email address. Unsubscribes, on the other hand, are influenced by acquisition sources, messaging content and timing, the specific context a nonprofit faces, and the strategic choices they make in response.
Messages per year per subscriber

On average, UK and Ireland nonprofits sent 8 fundraising appeals in 2024. It is not unusual for a nonprofit outside the UK and Ireland to send that many fundraising messages in December alone.
In fact, the average Other Countries nonprofit sent 30 fundraising emails in 2024 — the total messaging of all types for nonprofits in the UK and Ireland.
We would never say that there is a “right” number of fundraising messages to send — but we are not above heavily implying while winking exaggeratedly and waggling our eyebrows that sending more than 8 fundraising appeals in a year would increase email fundraising results.
Messages per subscriber per month

In the UK and Ireland, messaging was fairly steady throughout the year. Other countries' fundraising is far more end-of-year-focused, at an average of 12.9 messages per subscriber in December. (The tax treatment of charitable giving is a key driver of late-December giving in the United States, which makes this an especially busy time for fundraising messaging.)
Email messages per month per subscriber

Change in email messages per year 2023 to 2024

This messaging volume represented a 31% increase from the previous year. Advocacy messaging volume increased by 22%, while messaging classified as Engagement (e.g. quizzes, surveys, votes) increased by 56%. Despite this increase in messages year over year, the 75th percentile of UK and Ireland isn’t even sending the median of the non-UK countries.
Change in email revenue 2023 to 2024

Yes, email programmes grew — more messages reached more people. But also: yes, email programmes declined.
Average annual email revenue for UK and Ireland nonprofits in our study decreased by 12% from 2023 to 2024. This is in line with the decline we saw in the Other Countries segment (-11%). Nonprofits in the Rights sector saw a 36% average drop. Average email revenue increased slightly year over year for the Wildlife/Animal Welfare (+15%) and Health (+4%) sectors.
Share of online revenue from email

The share of online revenue from email dropped slightly year over year, from 9% in 2023 to 8% in 2024, continuing to make up nearly the same percentage of online revenue. Email revenue continues to make up slightly more of the share of online revenue for the Other Countries segment, making up 11% in 2024.
Email revenue per 1,000 fundraising emails sent (£)

Email revenue per 1,000 fundraising emails sent (€)

For every 1,000 email messages sent, UK and Ireland nonprofits in our study raised an average of £58 (€70). That means an average fundraising appeal sent to a list of 100,000 subscribers would raise £5,800 (€7,018) in revenue.
There were significant differences between sectors on this metric. Rights nonprofits received £30 (€36) per 1,000 fundraising emails sent, while Wildlife/Animal Welfare received £98 (€119) per 1,000 fundraising emails sent and Disaster/International Aid nonprofits received £200 (€242) per 1,000 fundraising emails sent.
The revenue per 1,000 email fundraising emails metric dropped significantly, and was 39% lower than in 2023, matching the overall decline in email revenue.
Change in fundraising response rate 2023 to 2024

Change in email revenue per 1,000 fundraising emails sent 2023 to 2024

Email metrics overall in the UK and Ireland are higher than in the non-UK countries.
Email messaging rates by type and sector

But we also saw a significant decline in fundraising response rate in UK and Ireland nonprofits from 2023 to 2024 (30%). This was especially pronounced in the Rights sector (41%), and this drop was more steep than the drop we saw in the non-UK and Ireland countries.
Email messaging rates
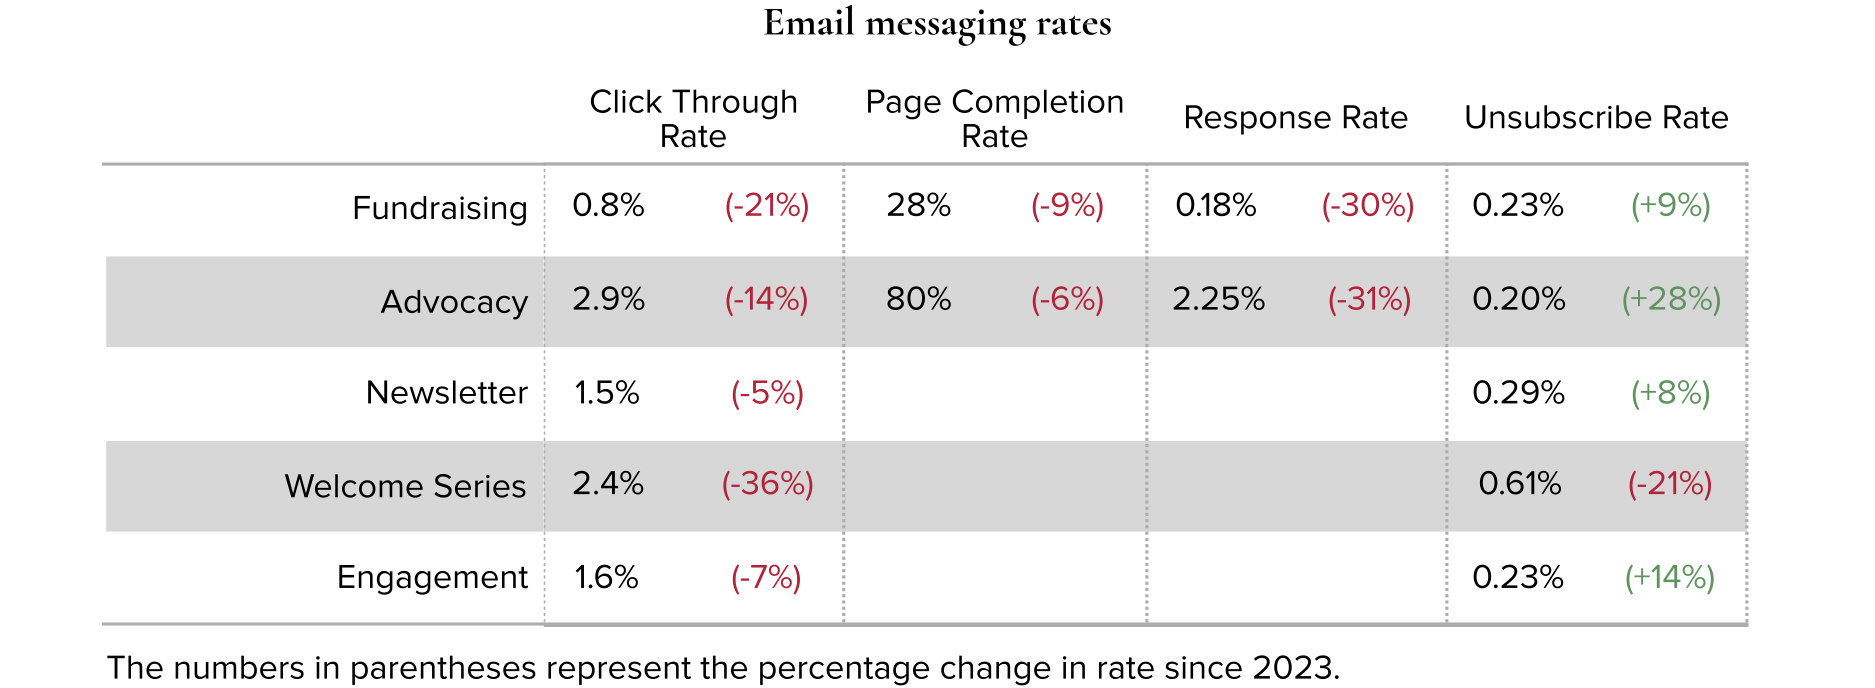
Taken all together — bigger email lists and higher messaging volume, paired with a decline in email revenue meant that email became less effective year over year.
In fact, we saw declines in email metrics across the board, with particularly large declines in response rate.
Despite the declines in response, the growth in list size meant that the overall percent of revenue from email fundraising remained relatively static year over year. Despite the challenges of email fundraising, email programmes continue to be a key part of online success, and that doesn't seem to be changing anytime soon.
Email remains a critical part of most nonprofits’ fundraising ecosystem and a critical way to communicate, educate, engage, mobilise, and build relationships with supporters. Thinking deeply about every part of the experience, from the subject line to the way a donation page upsell lightbox appears on mobile, is the kind of care and attention it takes to build a successful email programme.
List growth
Messages per subscriber per month
Messages per year per subscriber
Ratio of new joins to start of year email list size
Share of online revenue from email
Email messaging rates
Email revenue per 1,000 fundraising emails sent (£)
Email revenue per 1,000 fundraising emails sent (€)
Email revenue per subscriber (£)

Email revenue per subscriber (€)

Change in fundraising response rate 2023 to 2024
Email messaging rates by type and sector
Email messages per month per subscriber
Bounces and Unsubscribes
Change in email messages per year 2023 to 2024
Change in email revenue 2023 to 2024
Change in email revenue per 1,000 fundraising emails sent 2023 to 2024
O bella bionda,
Sei come l'onda!
Of cool sweet dew and radiance mild
The moon a web of silence weaves
In the still garden where a child
Gathers the simple salad leaves.
A moon-dew stars her hanging hair,
And moonlight kisses her young brow;
And, gathering, she sings an air:
"Fair as the wave is, fair, art thou!"
Be mine, I pray, a waxen ear
To shield me from her childish croon,
And mine a shielded heart for her
Who gathers simples of the moon.
Mobile messaging is a channel of immediacy and efficiency. No social media algorithms to limit your reach, not even the need for a supporter to log in to their email, let alone pick your message out of the teeming inbox.
Mobile list growth

Mobile list sizes increased by an average of 3% in 2024, building on a 4% increase in the previous year.
The developing nature of mobile messaging programmes can also be seen when compared to email. For every 1,000 email subscribers, nonprofits had 112 mobile subscribers.
For every 1,000 email subscribers, groups have this many mobile subscribers...

Messaging volume was lower for mobile than for email. While nonprofits sent an average of 8 fundraising emails per subscriber in 2024, they sent just 3.1 mobile fundraising asks per subscriber.
Mobile messages per year per subscriber

Change in mobile messages per year 2023 to 2024

Mobile messaging volume decreased overall by 10% in 2024. But nonprofits increased the number of fundraising mobile messages dramatically, sending 57% more fundraising messages than in the previous year.
Mobile fundraising messages had an average click-through rate of 9.8%, which was 85% higher than the previous year. Response rate for mobile messages also increased 62% to 2.6%. This is dramatically higher than the CTR and response rate we saw in the Other Countries segment.
Mobile Messaging Statistics
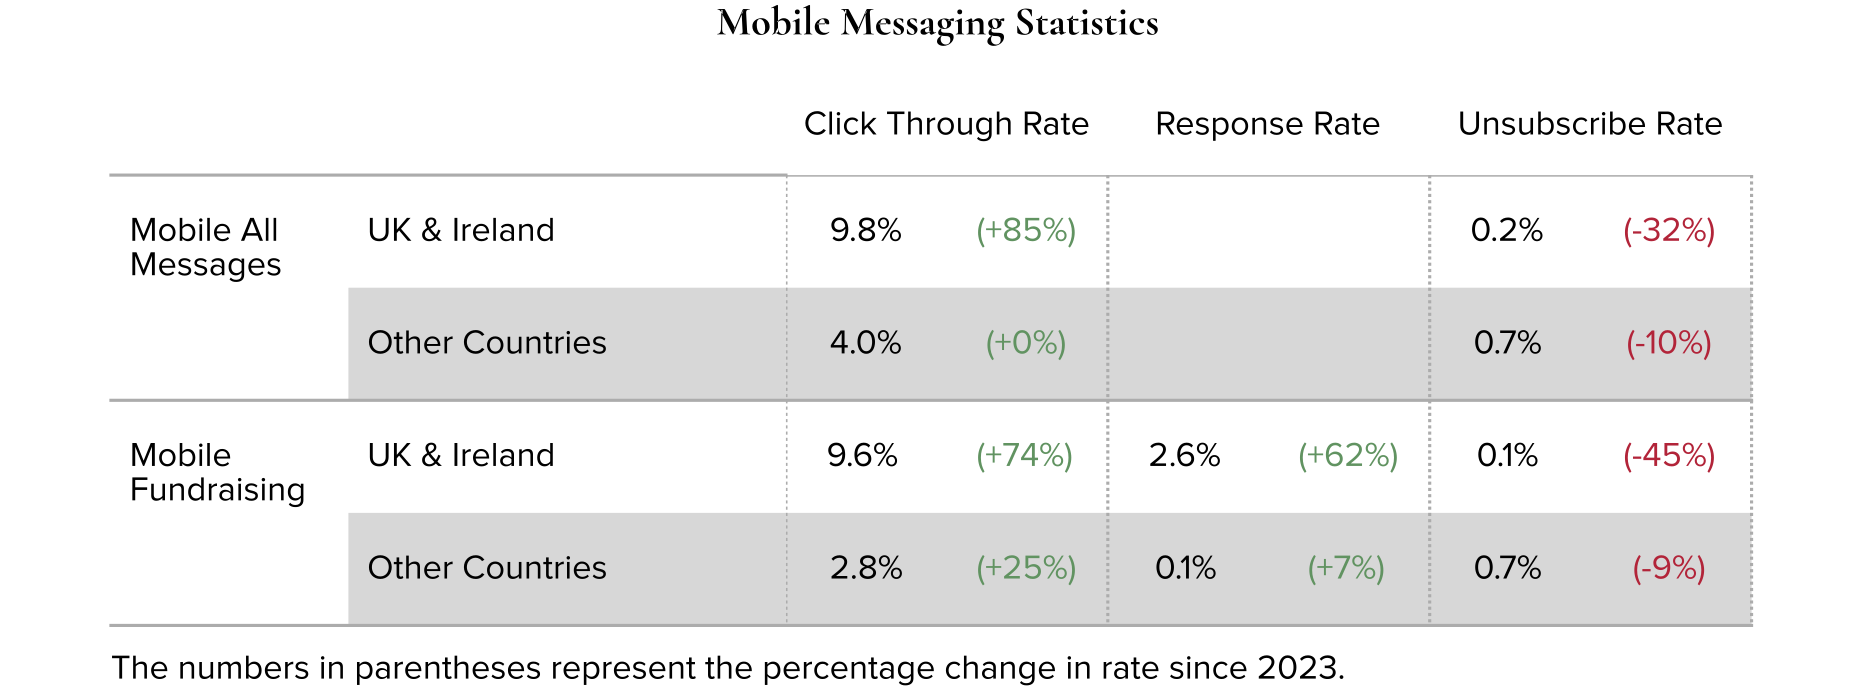
Summing up so far: nonprofits had smaller-but-growing mobile messaging audiences, smaller-but-growing messaging volume, and improved results across key metrics, especially for fundraising.
Overall, 1% of all online revenue was sourced to mobile messaging. For the UK and Ireland nonprofits in our study, overall mobile revenue declined 9% from 2023 to 2024, while mobile revenue increased by 37% in other countries.
Share of online revenue from mobile

Share of mobile revenue from regular giving

Regular giving made up less of the overall mobile revenue, declining from 93% of mobile revenue to 80% year over year.
For every pound raised through email, organisations raised this through mobile messaging

Despite these declines, mobile revenue remains extremely strong for UK and Ireland nonprofits in our study. For every pound raised through email, UK and Ireland nonprofits raised £0.36 (€0.44) in mobile giving, four times the revenue in the non-UK and Ireland nonprofits in our study.
For most nonprofits, mobile messaging contributed a small share of all giving, but audience sizes continued to increase and messaging strategies continued to evolve.
Share of online revenue from mobile
Mobile messages per year per subscriber
Share of mobile revenue from regular giving
Mobile revenue per 1,000 mobile fundraising messages sent (£)

Mobile revenue per 1,000 mobile fundraising messages sent (€)

Mobile Messaging Statistics
For every 1,000 email subscribers, groups have this many mobile subscribers...
For every pound raised through email, organisations raised this through mobile messaging
Mobile list growth
Mobile messages per subscriber per month

Change in mobile revenue per 1,000 mobile fundraising messages sent 2023 to 2024

Change in mobile messages per year 2023 to 2024
Change in mobile revenue 2023 to 2024

Love is like the wild rose-briar,
Friendship like the holly-tree—
The holly is dark when the rose-briar blooms
But which will bloom most constantly?
The wild rose-briar is sweet in spring,
Its summer blossoms scent the air;
Yet wait till winter comes again
And who will call the wild-briar fair?
Then scorn the silly rose-wreath now
And deck thee with the holly’s sheen,
That when December blights thy brow
He still may leave thy garland green.
Rights organisations in the UK and Ireland spent 61% more on digital advertising in 2024 than they did in 2023. That large increase isn’t only an indication that organisations increased spending during a busy electoral season (though it may be that). It’s a reminder that advertising is a channel that is especially nimble and scalable. Organisations have significant control over the audiences they reach, depending on spend and channel.
Change in investment in digital advertising 2023 to 2024

For UK and Ireland organisations overall, digital advertising spending increased by 6%, with Smaller organisations in particular reporting higher spending.
Smaller organisations also spent more on advertising relative to the size of their digital programmes. For every £1 raised online, Smaller nonprofits invested £0.30 in digital advertising. (Or, €0.30 for every €1 raised online.) Larger nonprofits invested £0.17 in digital advertising per £1 raised online. (Or, €0.17 for every €1 raised online.) To be clear, this is not a measure of return on investment; we are comparing the size of digital advertising budgets with the total raised online from all sources.
Overall, UK and Ireland nonprofits reinvested £0.26 in digital advertising per £1 raised online (or, €0.26 for every €1 raised online.); outside the UK and Ireland, the ratio was just £0.11 in digital advertising per £1 raised online (or, €0.11 for every €1 raised online.).
Investment in digital advertising divided by total online revenue (£)

Investment in digital advertising divided by total online revenue (€)

The lion’s share of digital advertising spending was devoted to direct fundraising efforts. Overall, UK and Ireland organisations spent 56% of advertising budgets on fundraising (well below the 70% for other countries). Larger organisations spent a greater share on fundraising (61%), compared to Smaller organisations, which reported roughly even split between direct fundraising and lead generation spending.
Share of digital advertising budget by goal

Lead generation advertising was primarily focused on social media, which accounted for 70% of lead generation budgets. Direct fundraising spending was more widely distributed; social made up 38% of budgets, search 24%, and the rest was spread across channels.
Share of digital advertising budget by goal and channel

As we’ve seen, digital advertising spending increased across the board in 2024, and there were some especially notable changes within channels.
Spending on multi-channel ad formats increased by 129% in the UK and Ireland. This category includes platforms like Google’s Performance Max, which use machine learning to serve creative assets including images, video, and text across a variety of media channels. Despite budgets more than doubling, this was still a very small portion for UK and Ireland organisations.
One other channel that is being used differently in the UK and Ireland compared to other countries is Connected TV. This is a channel that grew by 84% in other countries, but in the UK and Ireland, adoption was so sparse we were not able to collect enough data to make a year-over-year comparison.
Change in investment in fundraising advertising channels 2023 to 2024

Taken together, those results suggest that these multi-channel formats and connected TV could be the emerging channels with greatest potential for growth.
For a look at a channel in decline, we need only turn to X. Advertising spending dropped by 49% in 2024, though social media spending overall grew by 7%. Given the state of Twitter’s ownership (see for example the introduction re: the blood-dimmed tide), this seems unlikely to rebound soon.
Change in investment in fundraising advertising channels 2023 to 2024 Social media channels

So far, we’ve considered those digital advertising factors that are most firmly under the control of organisations — how much to spend, how to balance fundraising and visibility efforts, which channels to try out. Now, let’s turn to performance.
In 2024, search advertising had the highest ROAS of any channel. This has held true every year that we have reported advertising metrics in Benchmarks. For every pound spent on fundraising search ads, organisations raised £1.48. (Or, €1.48 for every €1 spent.)
Multi-channel ad formats also generated a remarkably strong ROAS at £1.22. As Google continues to embrace AI tools for search and advertising, this is another indication that this channel will become increasingly important.
Return on advertising spend (ROAS £)

Return on Advertising spend (ROAS €)

Return on ad spend (ROAS) by sector (£)

Return on ad spend (ROAS) by sector (€)

The primary reason search consistently generates the highest ROAS is that it also consistently has the lowest cost per donation. On average, nonprofits spent £31 (€38) on fundraising search advertising to generate a single donation — far below any other channel, and less than half what organisations in other countries reported.
Cost per donation (£)

Cost per donation (€)

Cost per donation by sector (£)

Cost per donation by sector (€)

We noted above that social media made up most lead generation spending. Organisations spent an average of £2.86 (€3.46) to generate a lead on Meta platforms, which helped bring the overall cost per advertising lead to £3.21 (€3.88) for UK and Ireland nonprofits.
Cost per advertising lead by platform (£)

Cost per advertising lead by platform (€)

Cost per advertising lead (£)

Cost per advertising lead (€)

This spending was an important source of email list growth for many organisations. The ratio of ad-acquired leads to start-of-year email list size was 0.18. That means that an organisation with an email list of 100,000 subscribers on 1 January would add 18,000 new subscribers through advertising efforts over the course of the year.
Ratio of ad-acquired leads to start of year email list size

All of the advertising data we have reviewed so far has included only traditional pay-to-play spending. The results look quite different for Google Grants, the programme that offers nonprofits search placement that behaves like paid results, but with restrictions that tend to make them uncompetitive with paid advertising.
The ROAS for these Google Grants campaigns was £0.17 (€0.21) for UK and Ireland nonprofits; a far cry from the £1.48 (€1.79) for paid search. Cost per donation was correspondingly high — organisations spent the equivalent of £402 (€486) to generate a single donation. (This is not a true cost, since these placements are paid for with Google Grant credits.)
Google grants ROAS (£)

Google Grants ROAS (€)

Google Grants cost per donation (£)

Google Grants cost per donation (€)

Google Grants site visits per £1k

Despite these relatively unappealing direct fundraising numbers, Google Grants can help support digital programmes. Nonprofits in the UK and Ireland received 357 site visits for every £1k in Grant spend. Finding ways to convert these visitors into supporters can help make Google Grants a more impactful part of an organisation’s advertising mix.
Cost per advertising lead (£)
Cost per advertising lead (€)
Return on advertising spend (ROAS £)
Return on Advertising spend (ROAS €)
Share of digital advertising budget by goal
Share of digital advertising budget by goal and channel
Investment in digital advertising divided by total online revenue (£)
Investment in digital advertising divided by total online revenue (€)
Ratio of ad-acquired leads to start of year email list size
Return on ad spend (ROAS) by sector (£)
Return on ad spend (ROAS) by sector (€)
Cost per donation (£)
Cost per donation (€)
Google Grants cost per donation (£)
Google Grants cost per donation (€)
Google grants ROAS (£)
Google Grants ROAS (€)
Google Grants site visits per £1k
Cost per donation by sector (£)
Cost per donation by sector (€)
Cost per advertising lead by platform (£)
Cost per advertising lead by platform (€)
Change in investment in fundraising advertising channels 2023 to 2024
Change in investment in fundraising advertising channels 2023 to 2024 Social media channels
Change in investment in digital advertising 2023 to 2024
Who has seen the wind?
Neither I nor you.
But when the leaves hang trembling,
The wind is passing through.
Who has seen the wind?
Neither you nor I.
But when the trees bow down their heads,
The wind is passing by.
Overall, 44% of visits to nonprofits in our study came from organic traffic. Organic traffic includes visitors who searched for a term and clicked on an unpaid result — excluding all other sources like direct links on other sites, social media, email, paid advertising, or users simply entering a URL.
Organic traffic volume as percent of overall traffic

Website share by device by sector

Of web traffic, in 2024, UK and Ireland nonprofits in our study saw the majority of their website traffic — 68% — came from users on mobile devices (this includes phones and tablets, but we’re just going to say “mobile” from now on).
This was a higher percentage than the mobile traffic in other countries. Mobile users also drove the majority of donation transactions for UK and Ireland nonprofits — showing how critical it is for websites and donation forms to be mobile-optimised.
But we can’t discount desktop users! Their giving is still making up the majority of donation revenue by a slight margin — driving 57% of donation revenue. This held despite the size of the nonprofit — though we did see some differences by sector, with Rights organisations still seeing more revenue from Desktop.
Average gift was also higher for UK and Ireland desktop users than for mobile visitors — £95 (€115) compared to £32 (€39). Both of these average gifts were lower than the average gift in the Other Countries segment, which were £163 (€196) and £85 (€103) respectively.
Average gift by device (£)

Average gift by device (€)

Among those visitors who did manage to make it to a website’s main donation page, (Benchmarks participants self-select which of their donation pages count as the “main donation page” for purposes of this study. Typically it’s the one you land on when you click the giant red DONATE button on the homepage.) average main donation page conversion rate was 11% for mobile users and 12% for desktop users.
We saw big differences by sector and size of organisation. Larger organisations had much stronger page conversion rates than smaller organisations, maybe driven by stronger name recognition and intent to donate once users land on their form or by larger investment into strong donation user experience.
Main donation page conversion rate by device

The goal for nonprofits is to give supporters options that work for them, especially when it comes to filling out payment information and completing a gift on a mobile device.
Other than credit cards, the most common form of payment accepted was PayPal, which nearly every single UK and Ireland nonprofit included on their main donation page (97%). There was also nearly universal adoption of direct debit (94%).
Many nonprofits also accepted payment via Google Pay (72%) and Apple Pay (66%).
Percentage of nonprofits accepting payment types on main donation page

The vast majority of users who arrive on a donation page do not complete a gift. Addressing that challenge is one of the most impactful ways that nonprofits can increase online revenue across channels.
Nonprofits are essentially evenly offering one-time or regular giving as the preselected option.
Giving option that is pre-selected when a user lands on an organisation’s main donation page

Do you have language or a feature on your main donation form that encourages users to make a recurring gift

Percent of organisations where, if someone makes a one-time gift on the main donation page, there is a recurring “upsell lightbox”

Most nonprofits promote regular giving on their main donation page, often with something like a little note that says how important reliable support is. That was the case for 61% of UK and Ireland nonprofits.
And 37% include an upsell lightbox — so if you make a one-time gift, you get a little ask popping up to make the case for monthly giving and encourage you to become a regular giver.
Recurring giving options available on the main donation form

91% of UK and Ireland nonprofits are offering regular giving options on their main donation form, and 6% are additionally offering the option to make an annually recurring cash gift.
Examining every one of these factors, and so many more, is part of how nonprofits are experimenting, optimising, and adapting. And that evolution is essential to recruiting committed supporters, stronger communities, and expanding movements.
Website share by device

Revenue per website visitor from all traffic (£)

Revenue per website visitor from all traffic (€)

Website share by device by sector
Percent of organisations where, if someone makes a one-time gift on the main donation page, there is a recurring “upsell lightbox”
Percent of website visitors who make a donation (all traffic)

Percentage of nonprofits accepting payment types on main donation page
Giving option that is pre-selected when a user lands on an organisation’s main donation page
Homepage load time (seconds)

Main donation page conversion rate by device
Organic traffic volume as percent of overall traffic
Average gift by device (£)
Average gift by device (€)
Donation page load time (seconds)

Do you have language or a feature on your main donation form that encourages users to make a recurring gift
Recurring giving options available on the main donation form
Social Media & Influencers
What Is an Epigram?
Samuel Taylor Coleridge
What is an Epigram? A dwarfish whole,
Its body brevity, and wit its soul.
Key Lines
Social Media & Influencers
The social media landscape was never built on solid ground, and over the years the shifting sands have swallowed up more than a few platforms. Even when a service is stable, the ways that users (and algorithms) behave are not. Audiences can erode over time, or migrate from one place to another.
This means that nonprofits can’t afford to remain static or assume that what has worked in the past can be relied on in the future. It means they have to go to where they can engage with an audience that matters to them. People move; nonprofits follow.
In 2024, Meta usage was just about universal for nonprofits — 98% reported a Facebook presence, and 95% were on Instagram. X (84%), LinkedIn (84%) and YouTube (77%) also enjoyed wide adoption. 59% were on TikTok.
Percentage of nonprofits using social media platforms
Facebook was the platform where nonprofits had the largest number of followers. The average audience size for UK and Ireland nonprofits in our study on Facebook was 70,551 users. Remember, that’s a median figure, which means that half of participants had a larger audience.
Average number of fans/followers...
Average audience size was smaller across other platforms, with some notable differences by sector.
Wildlife/Animal Welfare nonprofits had especially large audiences on highly visual social media platforms — where, presumably, adorable photos and videos of baby tigers and lambs becoming unlikely best friends provide an advantage. They had the higher median follower count on Instagram, Facebook, and TikTok.
While audiences were largest on Facebook, growth was relatively flat, with average follower count increasing by just 4%. Instagram audiences increased by an average of 15%, and LinkedIn by 27%. The fastest-growing social media platform with widespread adoption was TikTok, with a 40% average increase in followers from the previous year.
The only social media platform that saw a decline in average audience size was X (formerly known as Twitter). The decline was small — a 1% drop on average — but indicates a real risk of audience erosion on the platform.
Change in fans/followers 2023 to 2024
The future of Twitter/X
Despite the erosion of audiences on X and the unstable recent nature of the platform and its owner, most nonprofits (90%) were still active on X. Of those groups, 39% reported plans to leave or sunset their presence on X.
Whether or not they have plans to leave X, nonprofits on the platform have begun building a presence on emerging platforms. A relative handful have invested in Discord, but by far the most popular alternatives were Threads and Bluesky.
If you have started building a presence elsewhere, which of these emerging platforms have you explored
No matter how fast the fan and follower counts grow, there are vast audiences that lie outside a nonprofits’ reach. As they follow audiences to new platforms, they also need guides who will bring audiences to their door. In other words: influencers.
Among nonprofits in our study who replied to our questions about working with influencers, 77% reported working with influencers to expand their social media reach.
Of those who work with social influencers, these are the types of influencers they work with...
54% of UK and Ireland nonprofits in our study who worked with influencers reported working with only organic influencers, 8% reported working with paid influencers, and 38% engaged both organic and paid influencers.
What tier of influencers did you work with in 2024
The vast majority of programmes were working with micro influencers, with follower counts in the 10k–100k range (81%).
The majority of influencer programmes included a mix of visibility and persuasion content along with direct response efforts. Influencer programmes included narrative, culture change, and/or persuasion content (64%). Nonprofits with influencer programmes also used them to drive advocacy or volunteer actions (57%) and direct fundraising (64%).
What do you use paid influencers for
Instagram was far and away the most common platform for influencer partnerships — every nonprofit in our study with an influencer programme was active there in 2024.
TikTok was next, with 50% of influencer programmes active on the platform. After that, a large gap. The next-most popular platforms were used by just 13% of influencer programmes; this includes YouTube and X. And 6% of influencer programmes were also active on Twitch.
Which platform(s) did you activate influencer campaigns on
One final piece of social media work to look on and despair: Facebook Fundraisers. While some outliers saw some success, the once-promising source of revenue made little impact in 2024.
In 2024, revenue from Facebook Fundraisers fell by 60% from the previous year, and average revenue fell significantly across every issue area. Overall, donations made directly on Facebook amounted to just 0.2% of all online revenue in the UK and Ireland nonprofits in our study.
We need to flag here — we are looking at half a year of fundraising results for Ireland groups in our study. Facebook turned off fundraising tools on their platform to any charities in the EEA on 1 July, 2024, which may have impacted the year-over-year results.
Either way, the heyday of the Facebook fundraiser seems to be over.
Change in amount raised on Facebook
Share of online revenue from Facebook
The rapid shifts in audience preferences and algorithmic procedures, and sunsetting of fundraising on entire platforms mean nonprofits need to keep building a presence on the newest platforms. The best we can do is stay nimble, keep experimenting, and focus on finding supporters wherever they may be.
What tier of influencers did you work with in 2024
Which platform(s) did you activate influencer campaigns on
Share of online revenue from Facebook
The future of Twitter/X
What do you use paid influencers for
Percentage of nonprofits using social media platforms
Facebook Fundraisers average gift (£)
Facebook Fundraisers average gift (€)
Percent of Facebook revenue raised in each month
If you have started building a presence elsewhere, which of these emerging platforms have you explored
Change in fans/followers 2023 to 2024
Of those who work with social influencers, these are the types of influencers they work with...
Average number of fans/followers...
Average number of gifts to a Facebook Fundraiser
Change in amount raised on Facebook
Change in Facebook reach 2023 to 2024